Trade records can make market research more disciplined by showing where reported product flows occur and how they change. To support a business decision, the analyst must connect those observations to a specific choice, test alternative explanations, and identify what additional evidence is still needed.
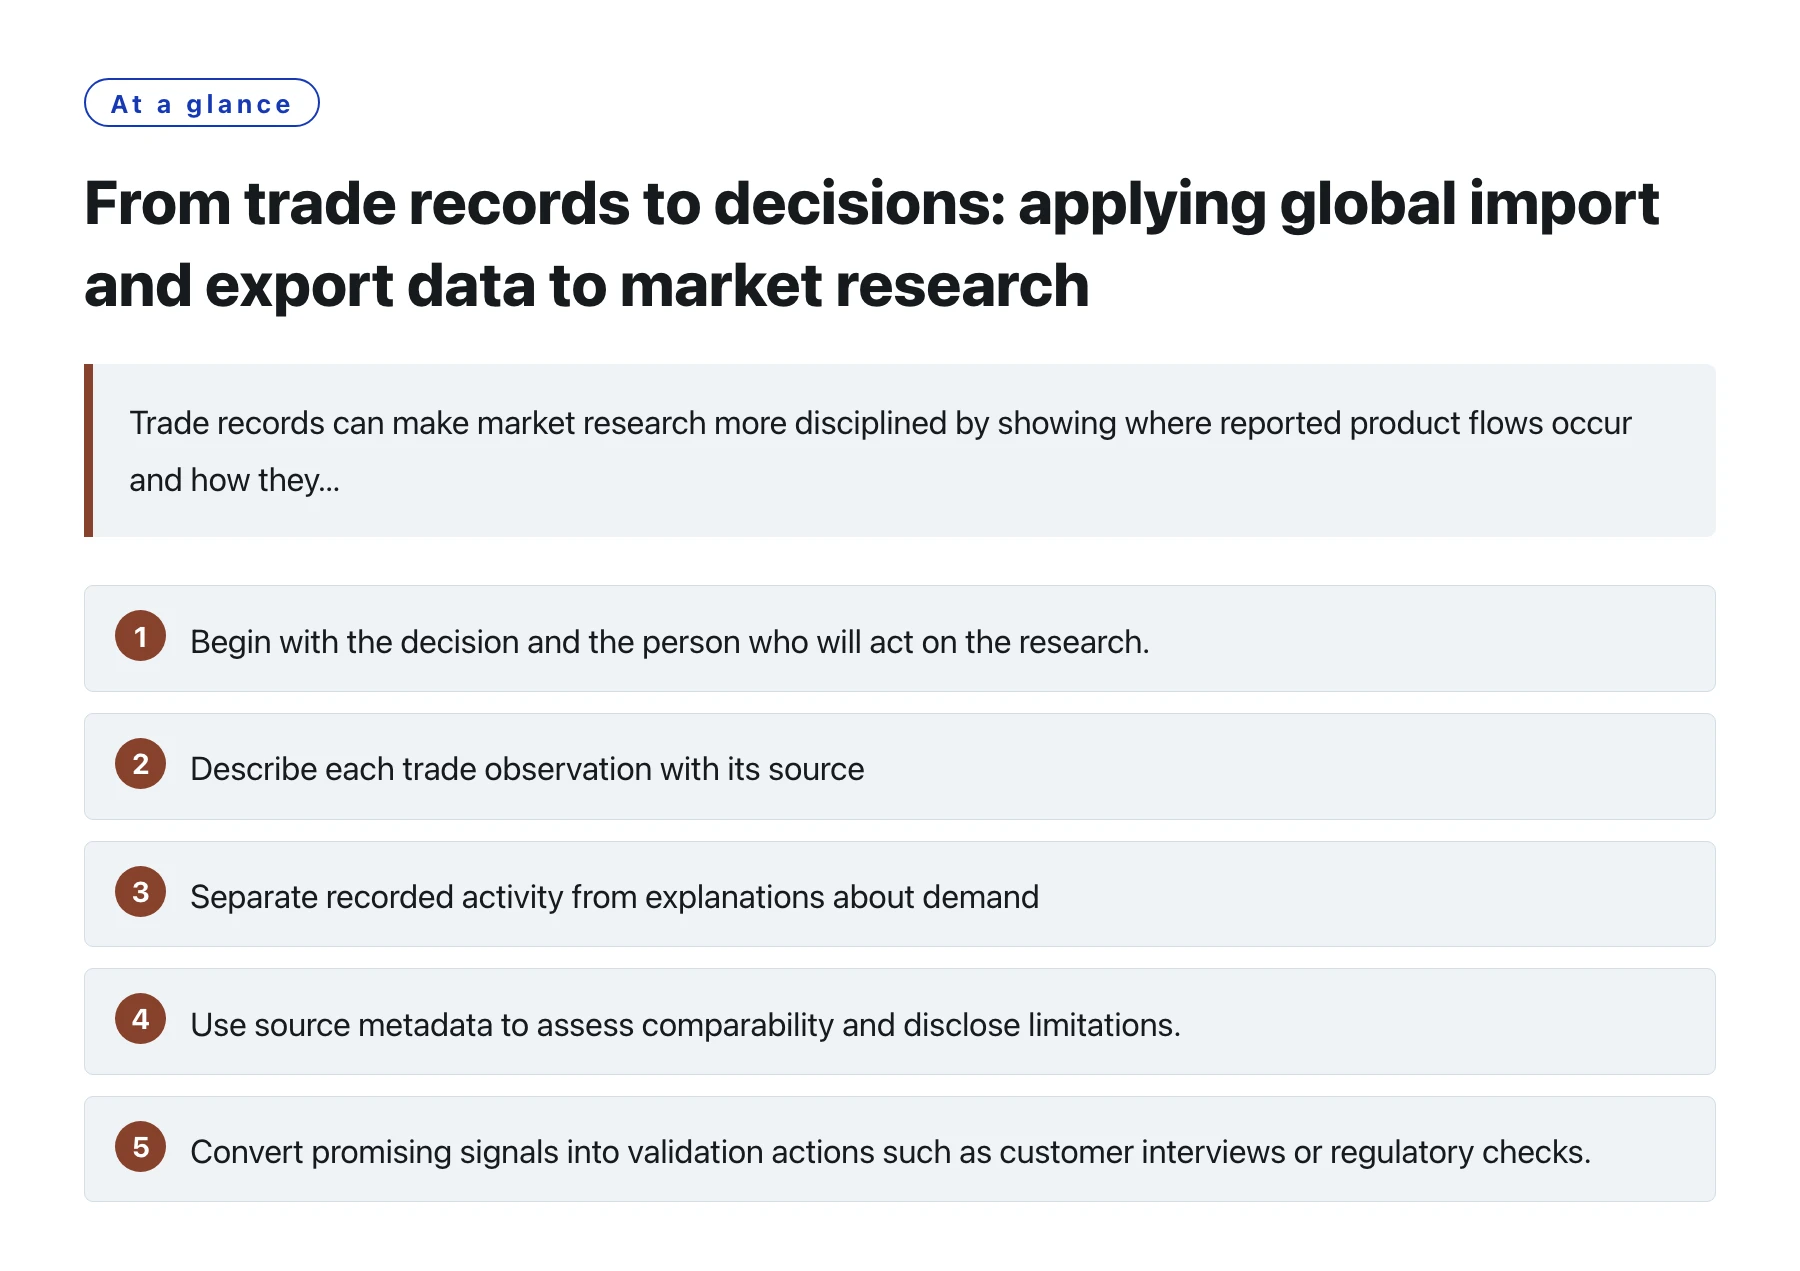
Key takeawaysBegin with the decision and the person who will act on the research. · Describe each trade observation with its source, product definition, reporter, partner, period, and unit. · Separate recorded activity from explanations about demand, competitiveness, or future opportunity. · Use source metadata to assess comparability and disclose limitations. [1] · Convert promising signals into validation actions such as customer interviews or regulatory checks.
A market research project can collect a large volume of trade data and still leave decision-makers unsure what to do. This usually happens when the analysis is organized around available fields rather than a choice. A decision-focused approach starts with the choice, assigns a narrow role to each dataset, and ends with a practical validation plan.
This article describes how an analyst can move from records to a recommendation without claiming more than the evidence supports. The examples are intentionally framed as a process: the correct interpretation depends on the product, jurisdiction, source, and business context.
1. Frame the decision as a testable question
Name the decision first: select a market for deeper research, compare sourcing geographies, decide which product segment to prioritize, or investigate a named trading company. Then define the smallest question that helps with that decision. “Which destinations have recorded imports in this product category across the last several periods?” is more answerable than “Where is the best opportunity?”
Before opening the data, write down a provisional decision rule. A market might move to the next stage when the series is persistent, when the product definition is reliable, and when the result is consistent with another source. A sourcing market might require evidence of multiple exporters and a route that is operationally plausible. These rules are not universal thresholds; they are a way to prevent the team from adjusting its standard after seeing a preferred result.
List the non-data factors that could overturn the initial screen. Duties, regulations, product standards, transport time, channel structure, payment risk, and customer preferences may matter more than the recorded flow. This ensures the analysis is scoped as an early filter, rather than as a complete market-entry recommendation.
2. Build the evidence around one consistent unit
Decide whether the analysis is about an economy, product code, company, shipment, or route. Keep those units distinct in the report. A country-level import total can reveal broad recorded activity but says little about one importer. A company record can suggest a relationship but may not represent the total market. A shipment description may be too broad to identify the exact product variant.
For each extracted value, retain the reporter, partner, flow direction, period, code, code description, unit, currency, and source. If the record is aggregated, preserve the grouping that produced it. If names are normalized or codes combined, retain the original identifiers and write down the transformation. This metadata lets reviewers understand whether a comparison is like-for-like.
Official statistical systems may differ in treatment of warehouses, free zones, re-exports, valuation, and coverage. The WTO’s technical notes discuss these methodological distinctions and the way they affect merchandise trade series. Use the notes of the relevant source to determine whether a change in the table reflects a real commercial pattern or a change in statistical treatment. [1]
3. Test at least one alternative explanation
Every apparent trend has possible alternatives. A reported increase may come from more physical volume, a price shift, exchange rates, a different product mix, a reporting revision, or a classification update. A new partner in a table may reflect a change in reporting granularity rather than a newly established commercial route. Do not choose one explanation just because it supports a planned strategy.
Use simple checks to see whether the conclusion survives. Compare values with quantities if both are available. Extend the time window to see whether the finding is a one-period spike. Check partner reports where possible, while recognizing that bilateral symmetry is not guaranteed. Recalculate under a narrow and a broader product definition, and record whether the market ranking changes materially.
If the conclusion changes under reasonable assumptions, that is a decision-relevant result. It may mean that more research is needed before allocating budget. A transparent sensitivity check can prevent a false sense of precision and show where the business case depends on uncertain classification or coverage.
4. Translate evidence into a next-stage research plan
An aggregate screen should lead to targeted follow-up. For a potential import destination, validate customer segments, local requirements, price expectations, distribution, and competing offers. For a sourcing question, review manufacturer capability, quality systems, capacity, lead times, and contract terms. For named companies, confirm legal identity and current relevance through independent sources.
The U.S. Census Bureau’s international trade portal illustrates the range of official data views available for a single national system, including classification, geography, time series, APIs, and data products. Its structure is a reminder that the researcher should select a data product by analytical question, rather than treat every downloadable table as interchangeable. [2]
When searchable company or shipment records are relevant, TradeData.Pro can be evaluated as one research resource. Review the available countries, periods, fields, update timing, and sample records against the specific follow-up task. Decide in advance what result would count as useful and what would cause the team to reject or defer a lead.
5. Write the recommendation in layers
- ObservationState what the selected source reports, including the product definition, geography, and period.
- InterpretationExplain the most plausible meaning and name other explanations that could fit the same observation.
- ConfidenceDescribe source coverage, missingness, code ambiguity, revision status, and corroborating evidence.
- ActionSpecify the next check, owner, and evidence needed before the business commits resources.
6. Keep the recommendation revisable
Market research is a snapshot of a question asked with the data available at a point in time. Record the extraction date and schedule a review when new periods are released, a classification changes, or an important assumption is resolved. A team should be able to update its conclusion without rebuilding the entire analysis from memory.
The final memo should distinguish a shortlist from a forecast. A shortlist tells the team where to investigate next. A forecast requires additional assumptions about customers, pricing, competition, and execution. By keeping those outputs separate, the analyst can use trade data to guide investment of research time without implying that historical recorded flows predict future revenue.
The practical test is whether a colleague can reproduce the query and understand why a market advanced or did not advance. If they can see the source, scope, method, limitations, and next action, the data has been converted into decision support rather than a chart collection.
Sources
Frequently asked questions
Does a rise in reported imports prove that customer demand is rising?
No. It is evidence about a trade series. Price, product mix, exchange rates, revisions, coverage, and other factors can also affect the reported value.
What should a trade-data recommendation include?
The question, source, product and geography definitions, period, method, observations, limitations, confidence, and a specific next action.
Can a market shortlist be treated as a sales forecast?
No. A shortlist identifies where to investigate. Forecasting requires additional evidence and assumptions about customers, pricing, competition, and execution.
How can analysts make findings easier to update?
Save the query details, extraction date, code mapping, source metadata, and transformations, then state what future evidence would change the conclusion.